Using Machine Learning to Predict Home Prices
Since my fiance and I are looking to buy our first home pretty soon I wanted to try to use machine learning to understand more about the housing market. I figured this might be a fun way to play around with some data while also learning about something that's relevant to my life. After looking around on Kaggle, I found a dataset that's actually pretty popular for experiementing with machine learning techniques - the Ames housing dataset.. It has data for over 1000 houses in Boston and their corresponding sale price, which is the target variable I'd be interested in.
The dataset has over 30 columns of info on each data point so before diving into any kind of machine learning, I wanted to figure out which variables were important to price. In other words, which features had a strong correlation with price. In order to do this, I created a correlation matrix of all the features. What was important to me was correlation with sale price, but some of the other correlation relationships were interesting as well. Below you can see this correlation matrix heat plot. I've found this is usually a good place to start with any kind of machine learning analysis.
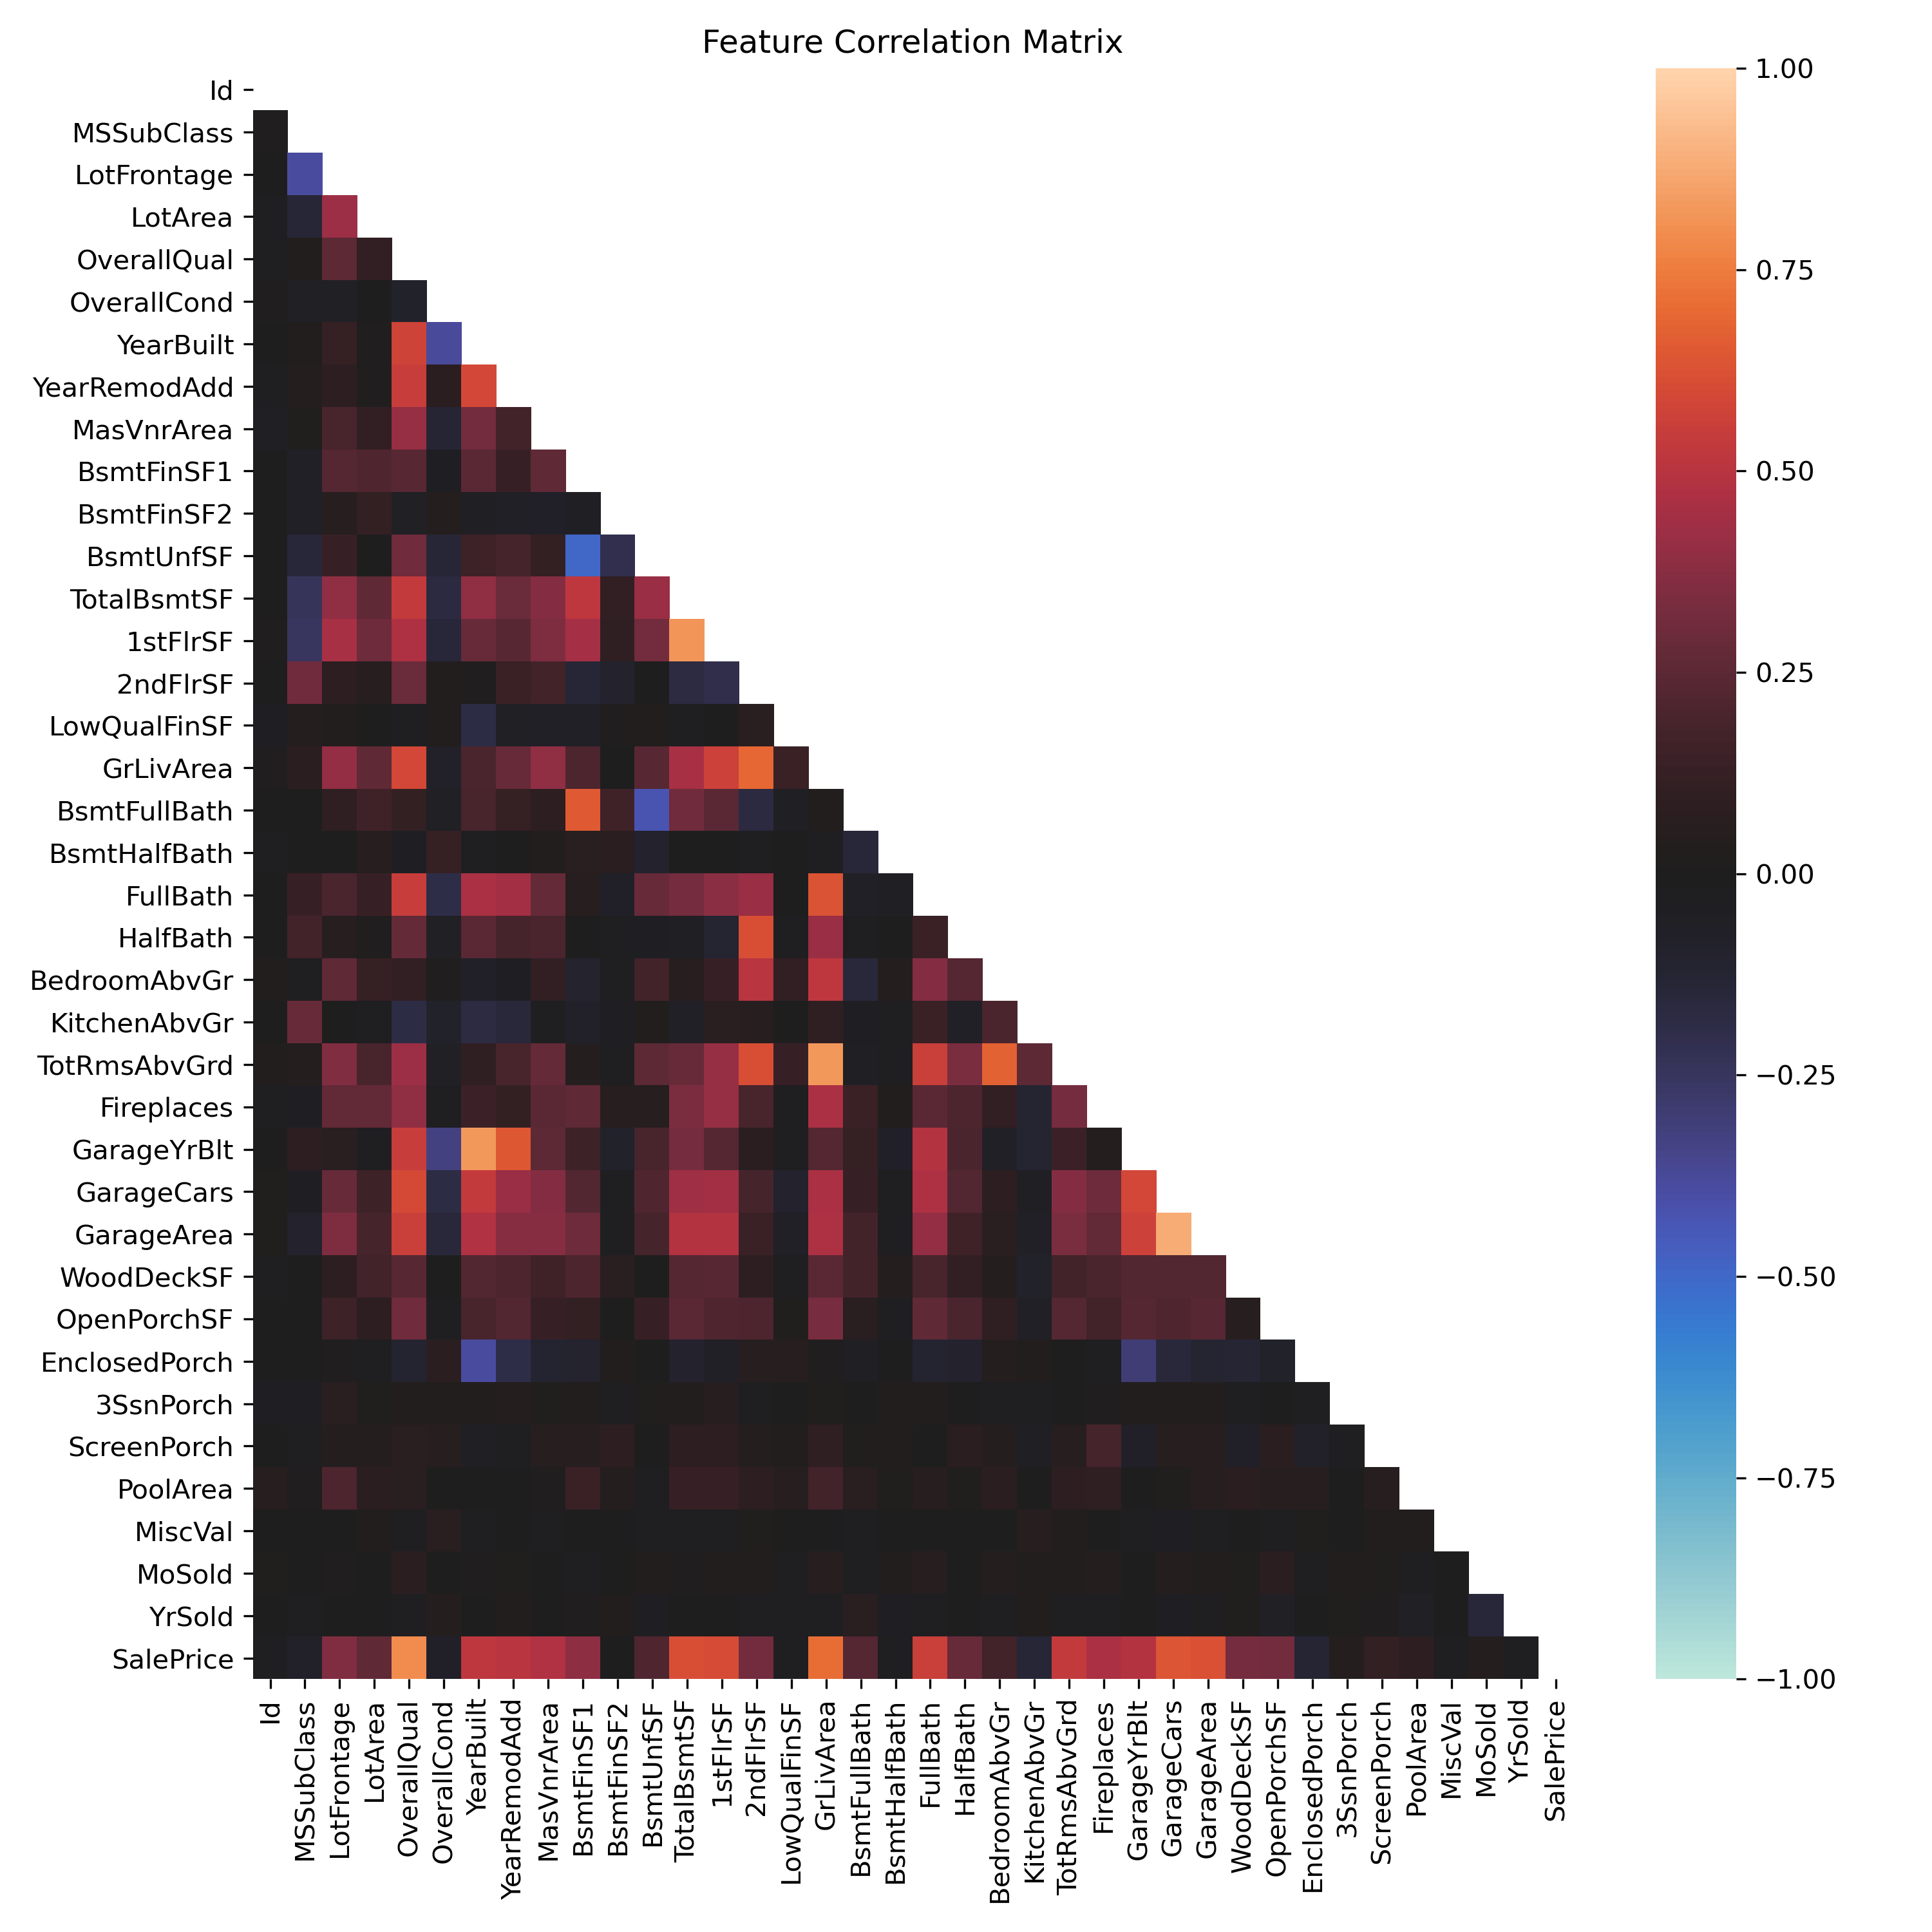 Correlation matrix for all features in this housing dataset.
As it turns out, the features that are mostly highly correlated with price are:
- OverallQual - overall quality of the house
- GrLivArea - above grade living area
- GarageCars - size of garage in car capacity
- GarageArea - square footage of garage area
- TotalBsmtSF - basement square footage
- 1stFlrSF - square footage of first floor
- FullBath - full bathrooms above grade
- TotRmsAbvGrd - total rooms above grade
- YearBuilt - year house was built
- YearRemodAdd - remodel date (same as construction if no remodel)
- GarageYrBlt - year garage was built
A quick box plot of the 'overall quality' feature vs. 'sale price' shows that there does seem to be a pretty clear relationship between these two features. Unfortunately 'overall quality' does seem a bit subjective, but I think this goes to show that the overall nice-ness of a home, for example let's say the kitchen was just recently rennovated, does play a significant role in sale price. What's more is that the relationship doesn't neccesarily seem linear.
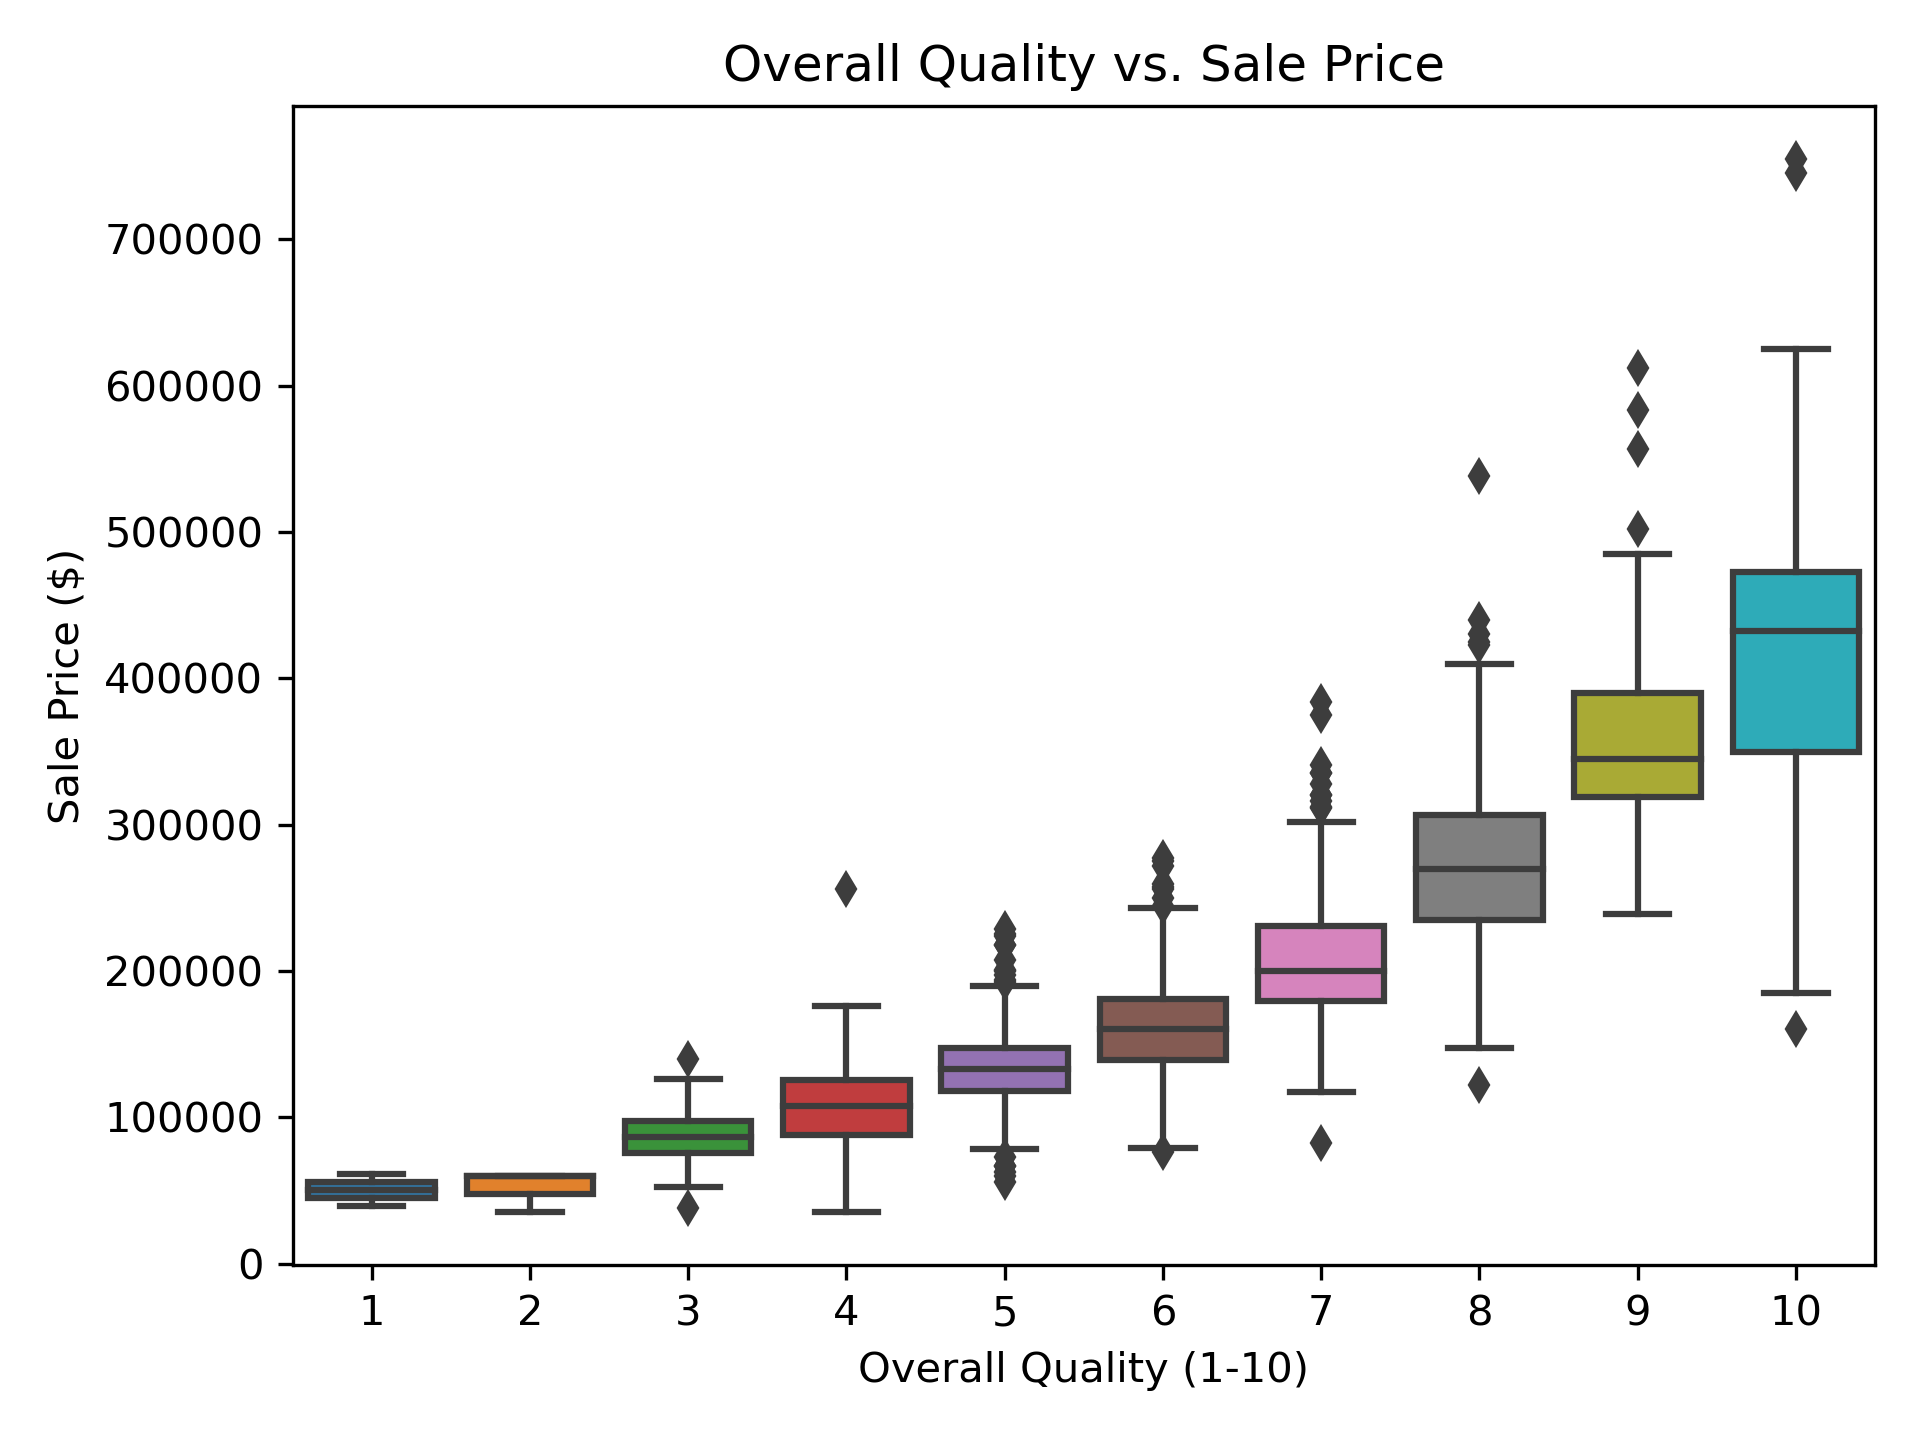 Scatter plot of overall quality rating vs. sale price.
I'll be honest my first thought was to try to use my favorite machine learning model, Random Forest, to try to predict home price. I trained a model up and while it performed well on in sample data, I found that it performed absolutely terribly on out of sample data. My first submitted attempt on Kaggle with my Random Forest predictions mustered up a measly 16% accuracy... After a little bit of research and a Homer Simpson 'doh' moment, I realized why random forest would not work for this application. Random forest is very bad at predicting data that increase over time, which is the case with many time series, like the stock market or home prices for example. Random forest is only capable of predicting target values that it's seen before, so if it's expected that the data will at some point rise to new unseen levels as is the case with market data, then random forest will hit a ceiling at the highest target value it's been trained on.
A much better technique for predicting increasing time series data like this is linear regression. I decided to use the Lasso linear regression (or L1 regression) method in Scikit for this approach. Lasso is very similar to standard linear least squares regression except in the cost function a feature-proportional error term is added called lambda. What this results in is a best fit that is slightly less sensitive to the features. Lasso in particular adds this proportional penalty using absolute value of residual error (while ridge regression uses squared error). Lasso can be really great for optimizing a fit with smaller data sets because at the expense of adding bias to your model, it can minimize variance, i.e. prevent overfitting. The optimal lambda value is solved for using cross validation, where the training data is chunked up and the the penalty term that results in minimal variance is chosen. You can see in the plot below that R2 of our model decreases if lambda is too high which suggests that there is indeed some optimal value.
 R2 vs. λ selection for Lasso linear regression.
Overall the Lasso regression model performed pretty well predicting over 78% of out of sample data points accurately. Much better than random forest, but I think I'll still be hiring a realtor when I'm ready to buy a house! Feel free to check out all of my code here, and credit to Jan Kirenz for some of the lambda plotting code.