Machine Learning with Titanic Data
I thought it'd be interesting to play around with some datasets using some ML techniques from the Scikit and plot function from Seaborn. In the past I've found some great datasets from Kaggle, so I figured that would be a good place to start. After poking around I found a pretty cool dataset/challenge that seems to be pretty popular on the site. The data set is a partial list of members onboard the Titanic along with some info about them and whether or not they survived. The goal of the challenge is to build a model to predict whether the remaining passengers survived.
My first thought was to use one of the most basic and reliable techniques I know, k Nearest Neighbors. In my first attempt, I cleaned up the data, did some exploration of it, and then trained a kNN model using the cleaned data. Using Seaborn to plot some predicted survival percentage vs. age and class revealed some interesting and perhaps expected information. Overall this kNN technique scored a 68% on out of sample data when using a gridsearch to optimize hyperparameter selection.
Next, it was time to test out my other trusted ML algorithm, Random Forest. I used the same techniques to clean the data, trained a Random Forest regression model and found that it performed a bit better than kNN. I was able to get the model to predict about 79% of out of sample data points correctly. My thought is that 4 out of 5 predictions being correct isn't too shabby for such a quick and dirty analysis.
Looking at the plots of predicted survival percentage vs age and class was interesting. Especially the plot for class. It was almost like the model was telling a grim story about the reality of the Titanic disaster. The model seemed to suggest that first class passengers, younger children, and females seemed to have an overall higher change of survival, which seems to make a lot of sense. Scikit and Seaborn libraries worked great. I was able to build relatively accurate models and generate some nice looking plots (which you can see below) in just a few lines of code. Feel free to check out all of my code in my repository here.
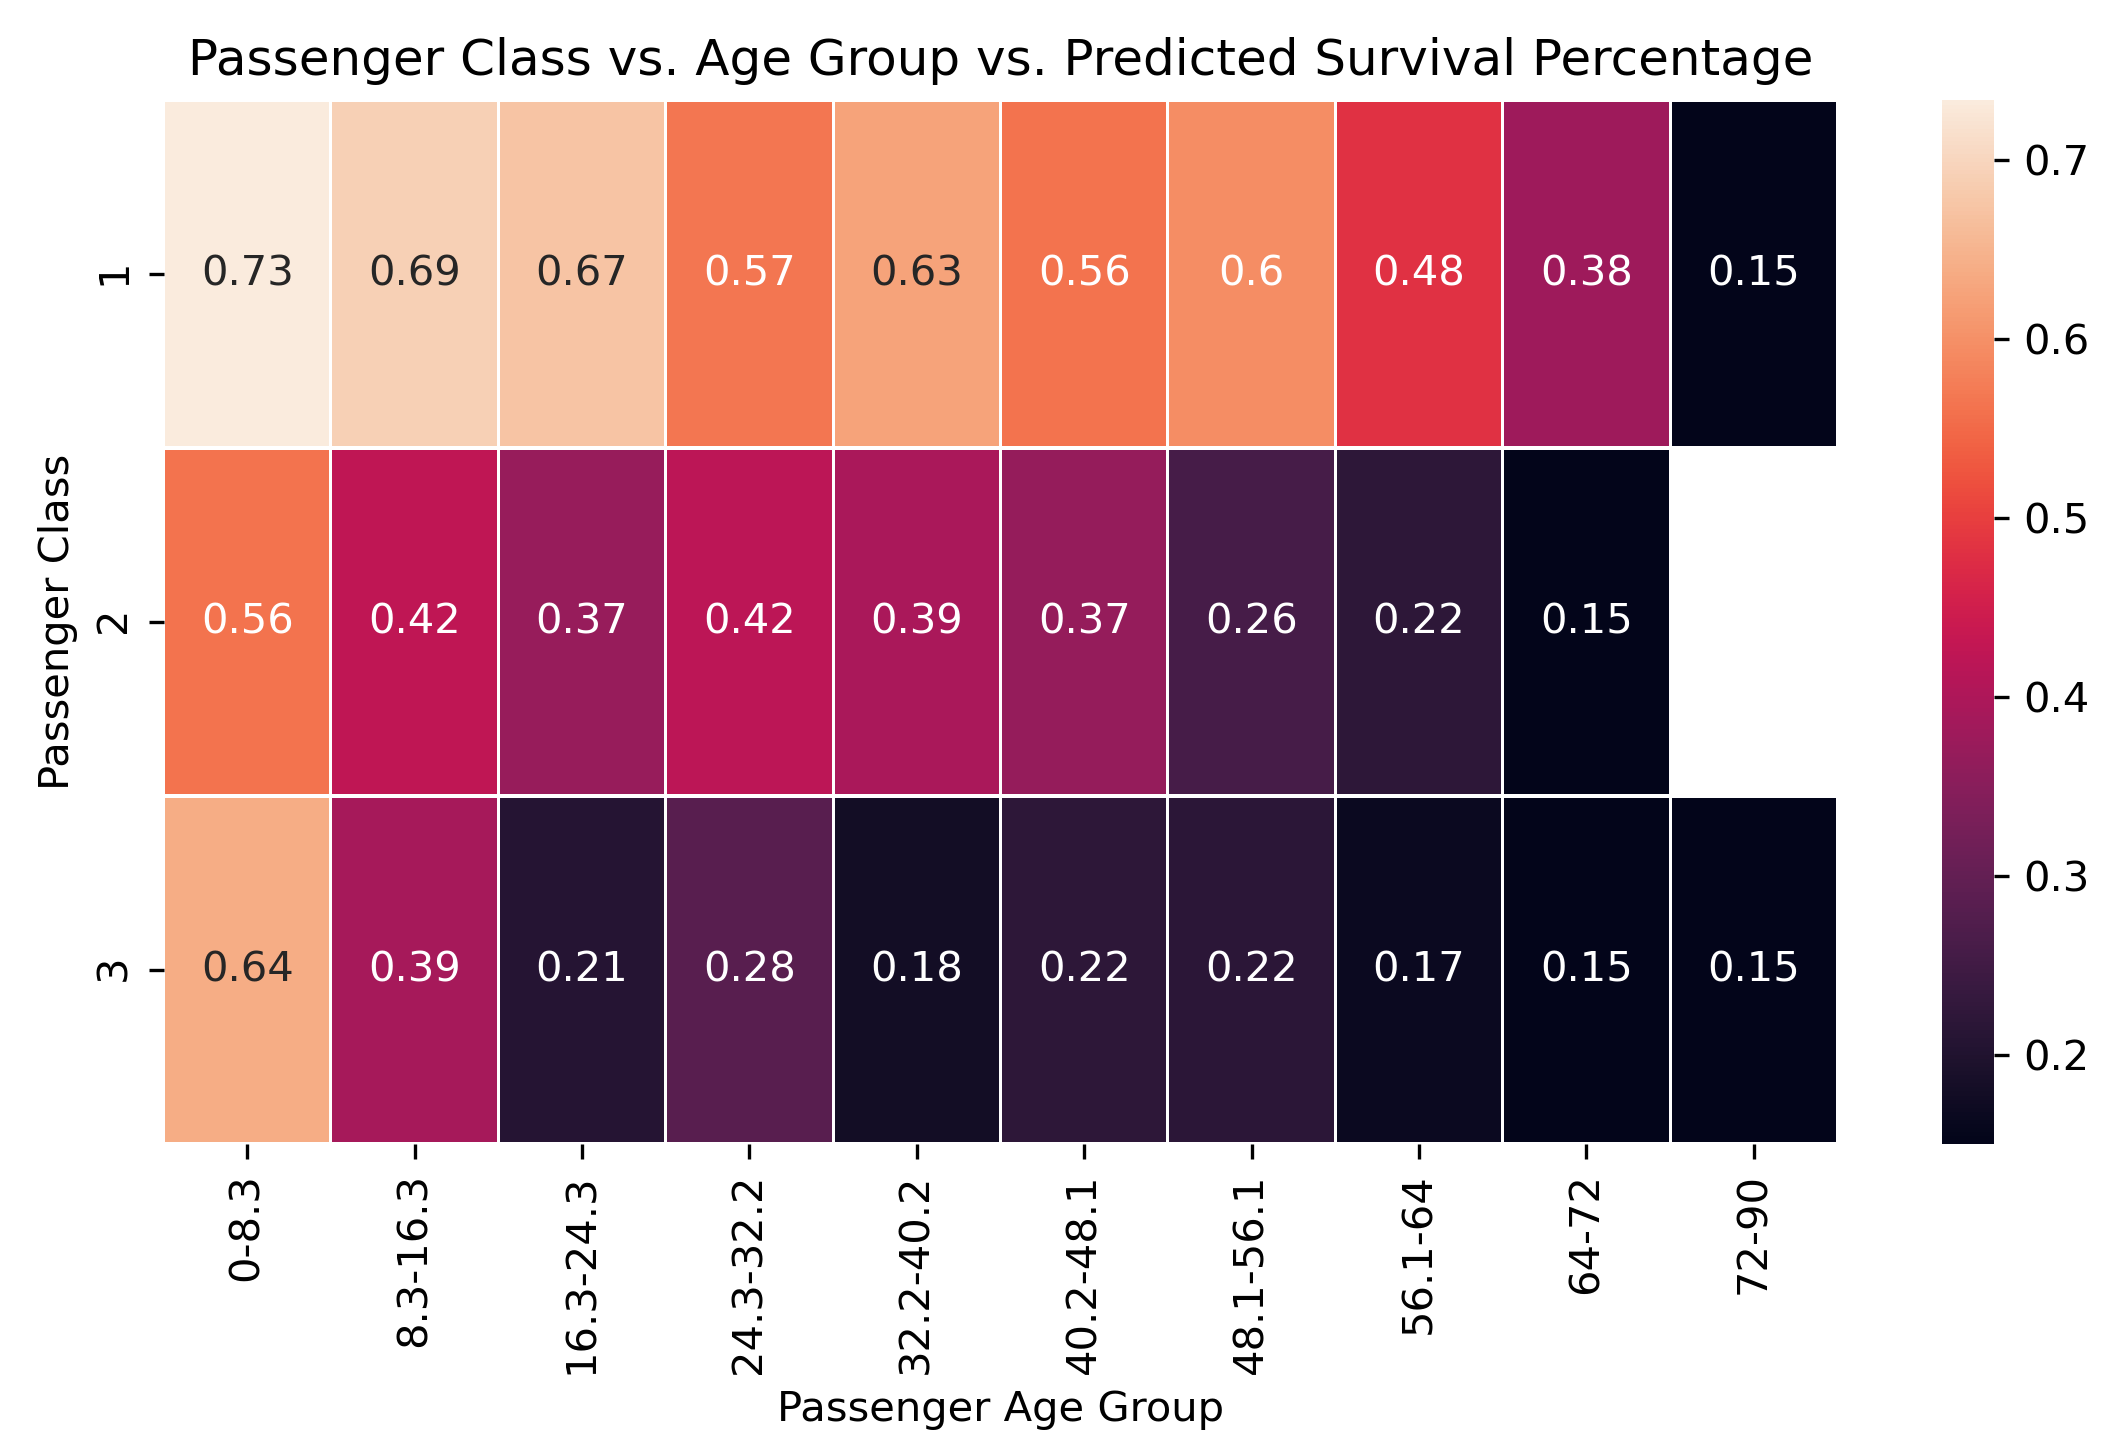 Seaborn heatmap plot of age vs. class vs. surival percentage predicted by Random Forest.
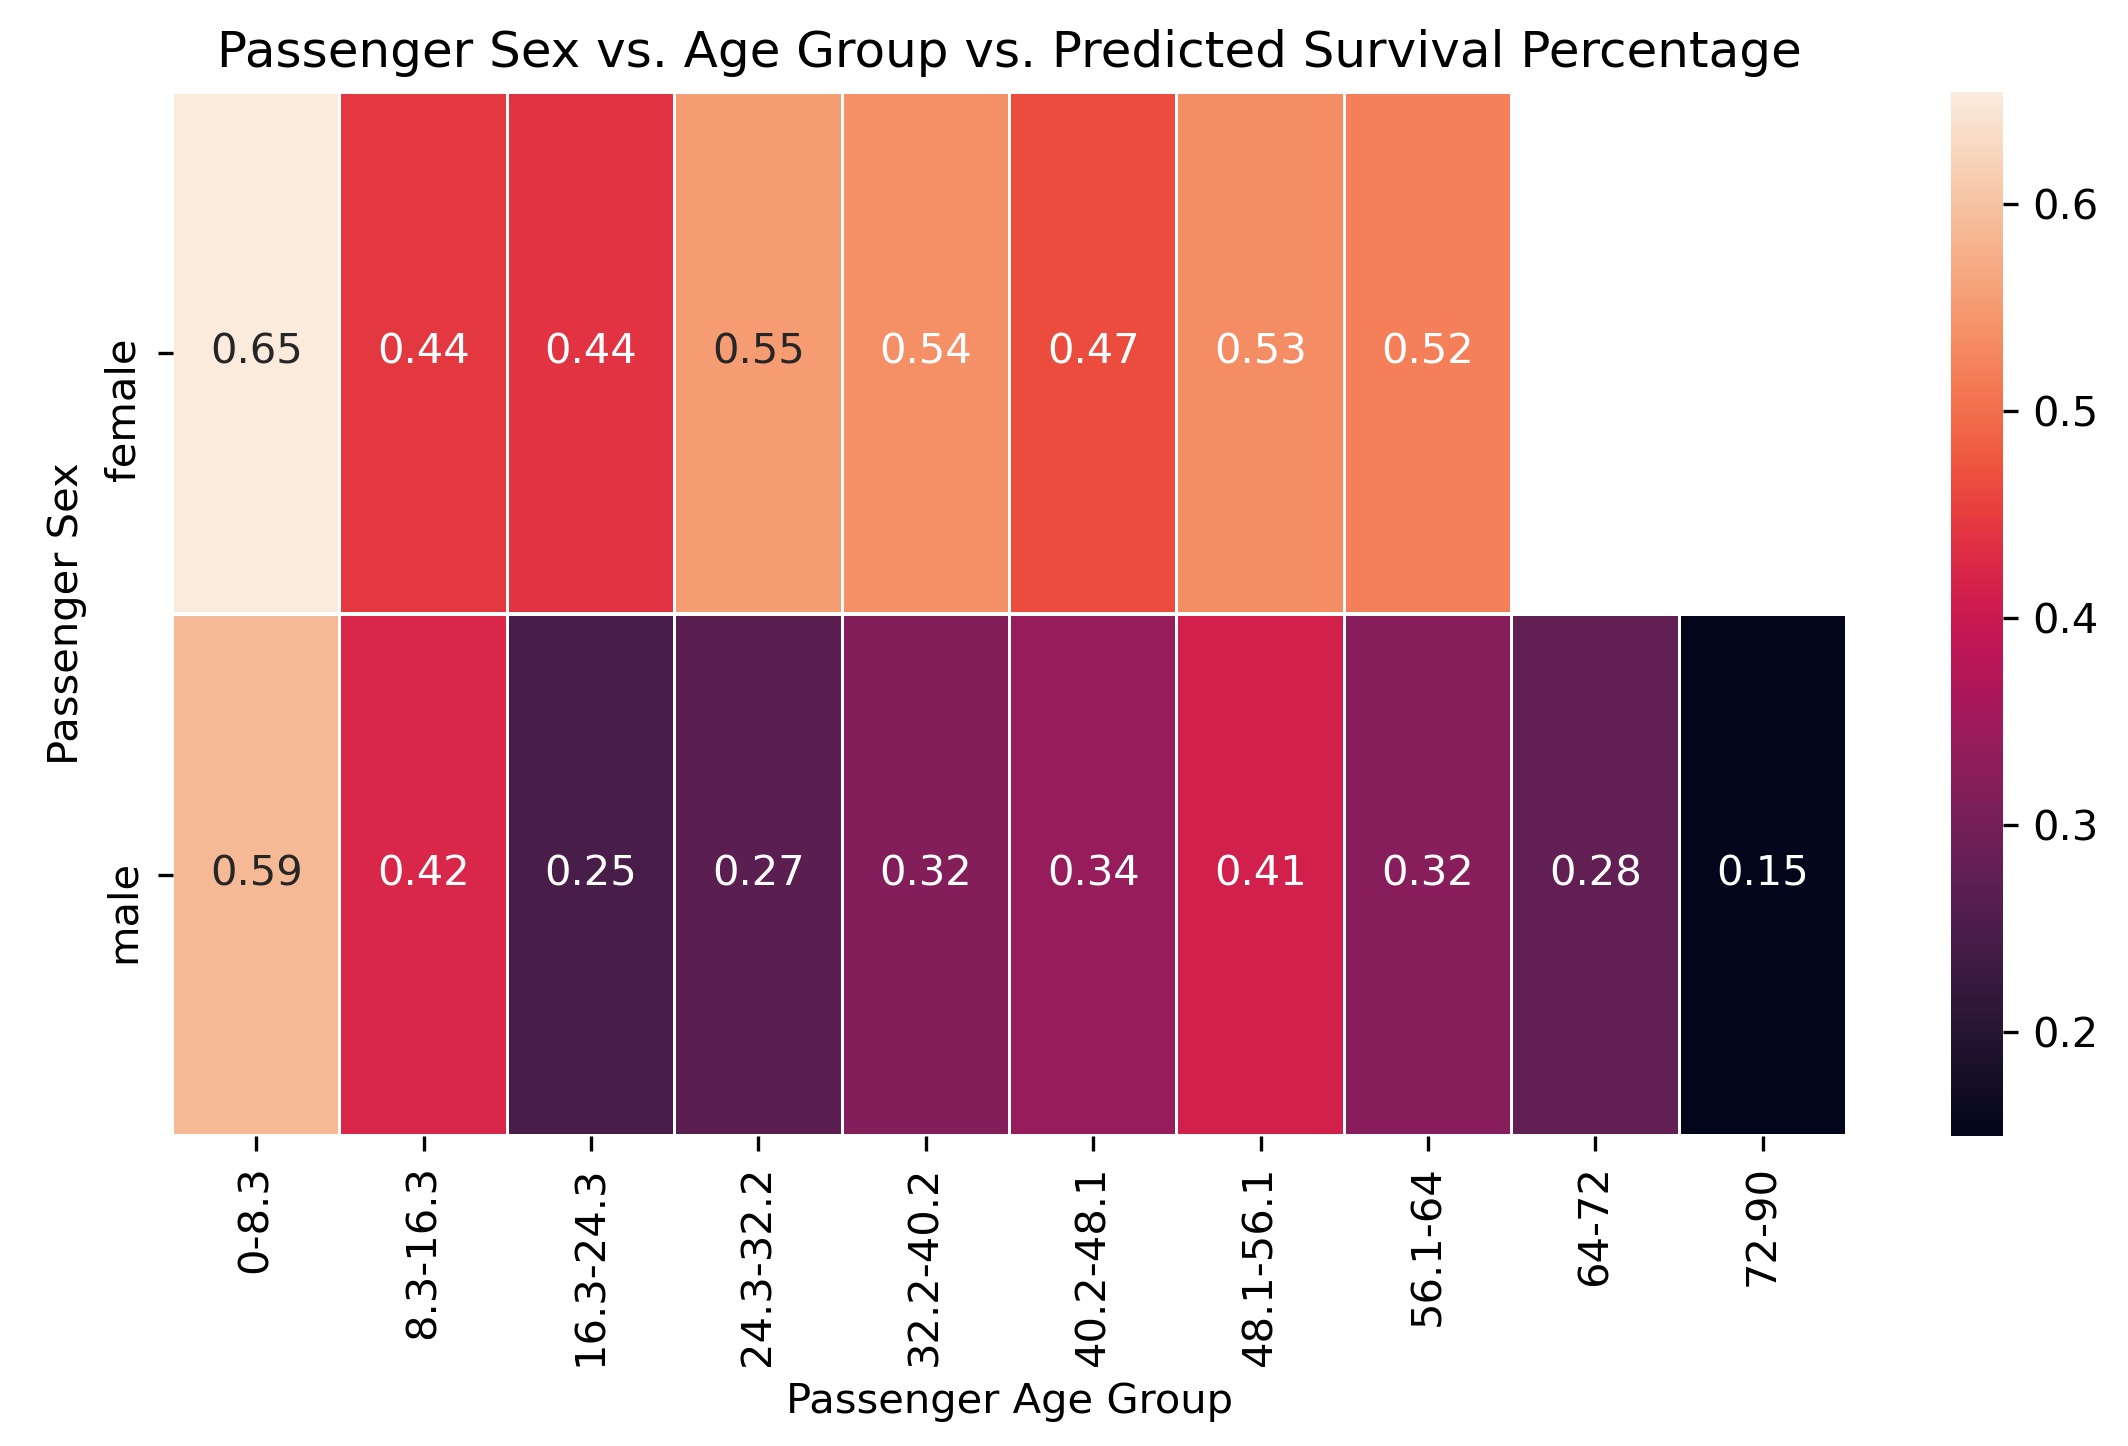 Seaborn heatmap plot of sex vs. age vs. surival percentage predicted by Random Forest.